Ethereum's energy expenditure
Ethereum is a green blockchain. Ethereum's proof-of-stake consensus mechanism uses ETH instead of energy to secure the network. Ethereum's energy consumption is approximately ~0.0026 TWh/yr (opens in a new tab) across the entire global network.
The energy consumption estimate for Ethereum comes from a CCRI (Crypto Carbon Ratings Institute) (opens in a new tab) study. They generated bottom-up estimates of the electricity consumption and carbon footprint of the Ethereum network (see the report (opens in a new tab)). They measured the electricity consumption of different nodes with various hardware and client software configurations. The estimated 2,601 MWh (0.0026 TWh) for the network’s annual electricity consumption corresponds to yearly carbon emissions of 870 tonnes CO2e applying regional-specific carbon intensity factors. This value changes as nodes enter and leave the network - you can keep track using a rolling 7-day average estimate by the Cambridge Blockchain network Sustainability Index (opens in a new tab) (note that they use a slightly different method for their estimates - details available on their site).
To contextualize Ethereum's energy consumption, we can compare annualized estimates for some other products and industries. This helps us better understand whether the estimate for Ethereum is high or low.
Annual Energy Consumption in TWh/yr
The chart above displays the estimated energy consumption in TWh/yr for Ethereum, compared to several other products and industries. The estimates provided are sourced from publicly available information, accessed in July 2023, with links to the sources available in the table below.
| Annualized energy consumption (TWh) | Comparison to PoS Ethereum | Source | |
|---|---|---|---|
| Global data centers | 190 | 73,000x | source (opens in a new tab) |
| Bitcoin | 149 | 53,000x | source (opens in a new tab) |
| Gold mining | 131 | 50,000x | source (opens in a new tab) |
| Gaming in USA* | 34 | 13,000x | source (opens in a new tab) |
| PoW Ethereum | 21 | 8,100x | source (opens in a new tab) |
| 19 | 7,300x | source (opens in a new tab) | |
| Netflix | 0.457 | 176x | source (opens in a new tab) |
| PayPal | 0.26 | 100x | source (opens in a new tab) |
| AirBnB | 0.02 | 8x | source (opens in a new tab) |
| PoS Ethereum | 0.0026 | 1x | source (opens in a new tab) |
*Includes end user devices such as PCs, laptops, and gaming consoles.
Getting accurate estimates for energy consumption is complicated, especially when what is being measured has a complex supply chain or deployment details that influence its efficiency. For example, estimates of energy consumption for Netflix and Google vary depending upon whether they only include the energy used to maintain their systems and deliver content to users (direct expenditure) or whether they include the expenditure required to produce content, run corporate offices, advertise, etc (indirect expenditure). Indirect expenditure could also include the energy required to consume content on end-user devices such as TVs, computers and mobiles.
The estimates above are not perfect comparisons. The amount of indirect expenditure that is accounted for varies by source, and rarely includes the energy from end-user devices. Each underlying source includes more details on what is being measured.
The table and chart above also include comparisons to Bitcoin and proof-of-work Ethereum. It is important to note that the energy consumption of proof-of-work networks is not static and changes day-to-day. Estimates can also vary widely between sources. The topic attracts nuanced debate (opens in a new tab), not only about the amount of energy consumed, but also about the sources of that energy and the related ethics. Energy consumption does not necessarily map precisely to environmental footprint because different projects might use different energy sources, including a lesser or greater proportion of renewables. For example, Cambridge Bitcoin Electricity Consumption Index (opens in a new tab) indicates that the Bitcoin network demand could theoretically be powered by gas flaring or electricity that would otherwise be lost in transmission and distribution. Ethereum's route to sustainability was to replace the energy-hungry part of the network with a green alternative.
You can browse energy consumption and carbon emission estimates for many industries on the Cambridge Blockchain Network Sustainability Index site (opens in a new tab).
Per-transaction estimates
Many articles estimate "per-transaction" energy expenditure for blockchains. This can be misleading because the energy required to propose and validate a block is independent of the number of transactions within it. A per-transaction unit of energy expenditure implies that fewer transactions would lead to smaller energy expenditure and vice-versa, which is not the case. Also, per-transaction estimates are very sensitive to how a blockchain's transaction throughput is defined, and tweaking this definition can be gamed to make the value seem larger or smaller.
On Ethereum, for example, the transaction throughput is not only that of the base layer - it is also the sum of the transaction throughput of all of its "layer 2" rollups. Layer 2's are not generally included in calculations, but accounting for the additional energy consumed by sequencers (small) and the number of transactions they process (large) would likely drastically reduce per-transaction estimates. This is one reason why comparisons of per-transaction energy consumption across platforms can be misleading.
Ethereum's carbon debt
Ethereum's energy expenditure is very low, but this has not always been the case. Ethereum originally used proof-of-work which had a much greater environmental cost than the current proof-of-stake mechanism.
From the very beginning, Ethereum planned to implement a proof-of-stake based consensus mechanism, but doing so without sacrificing security and decentralization took years of focused research and development. Therefore, a proof-of-work mechanism was used to get the network started. Proof-of-work requires miners to use their computing hardware to calculate a value, expending energy in the process.
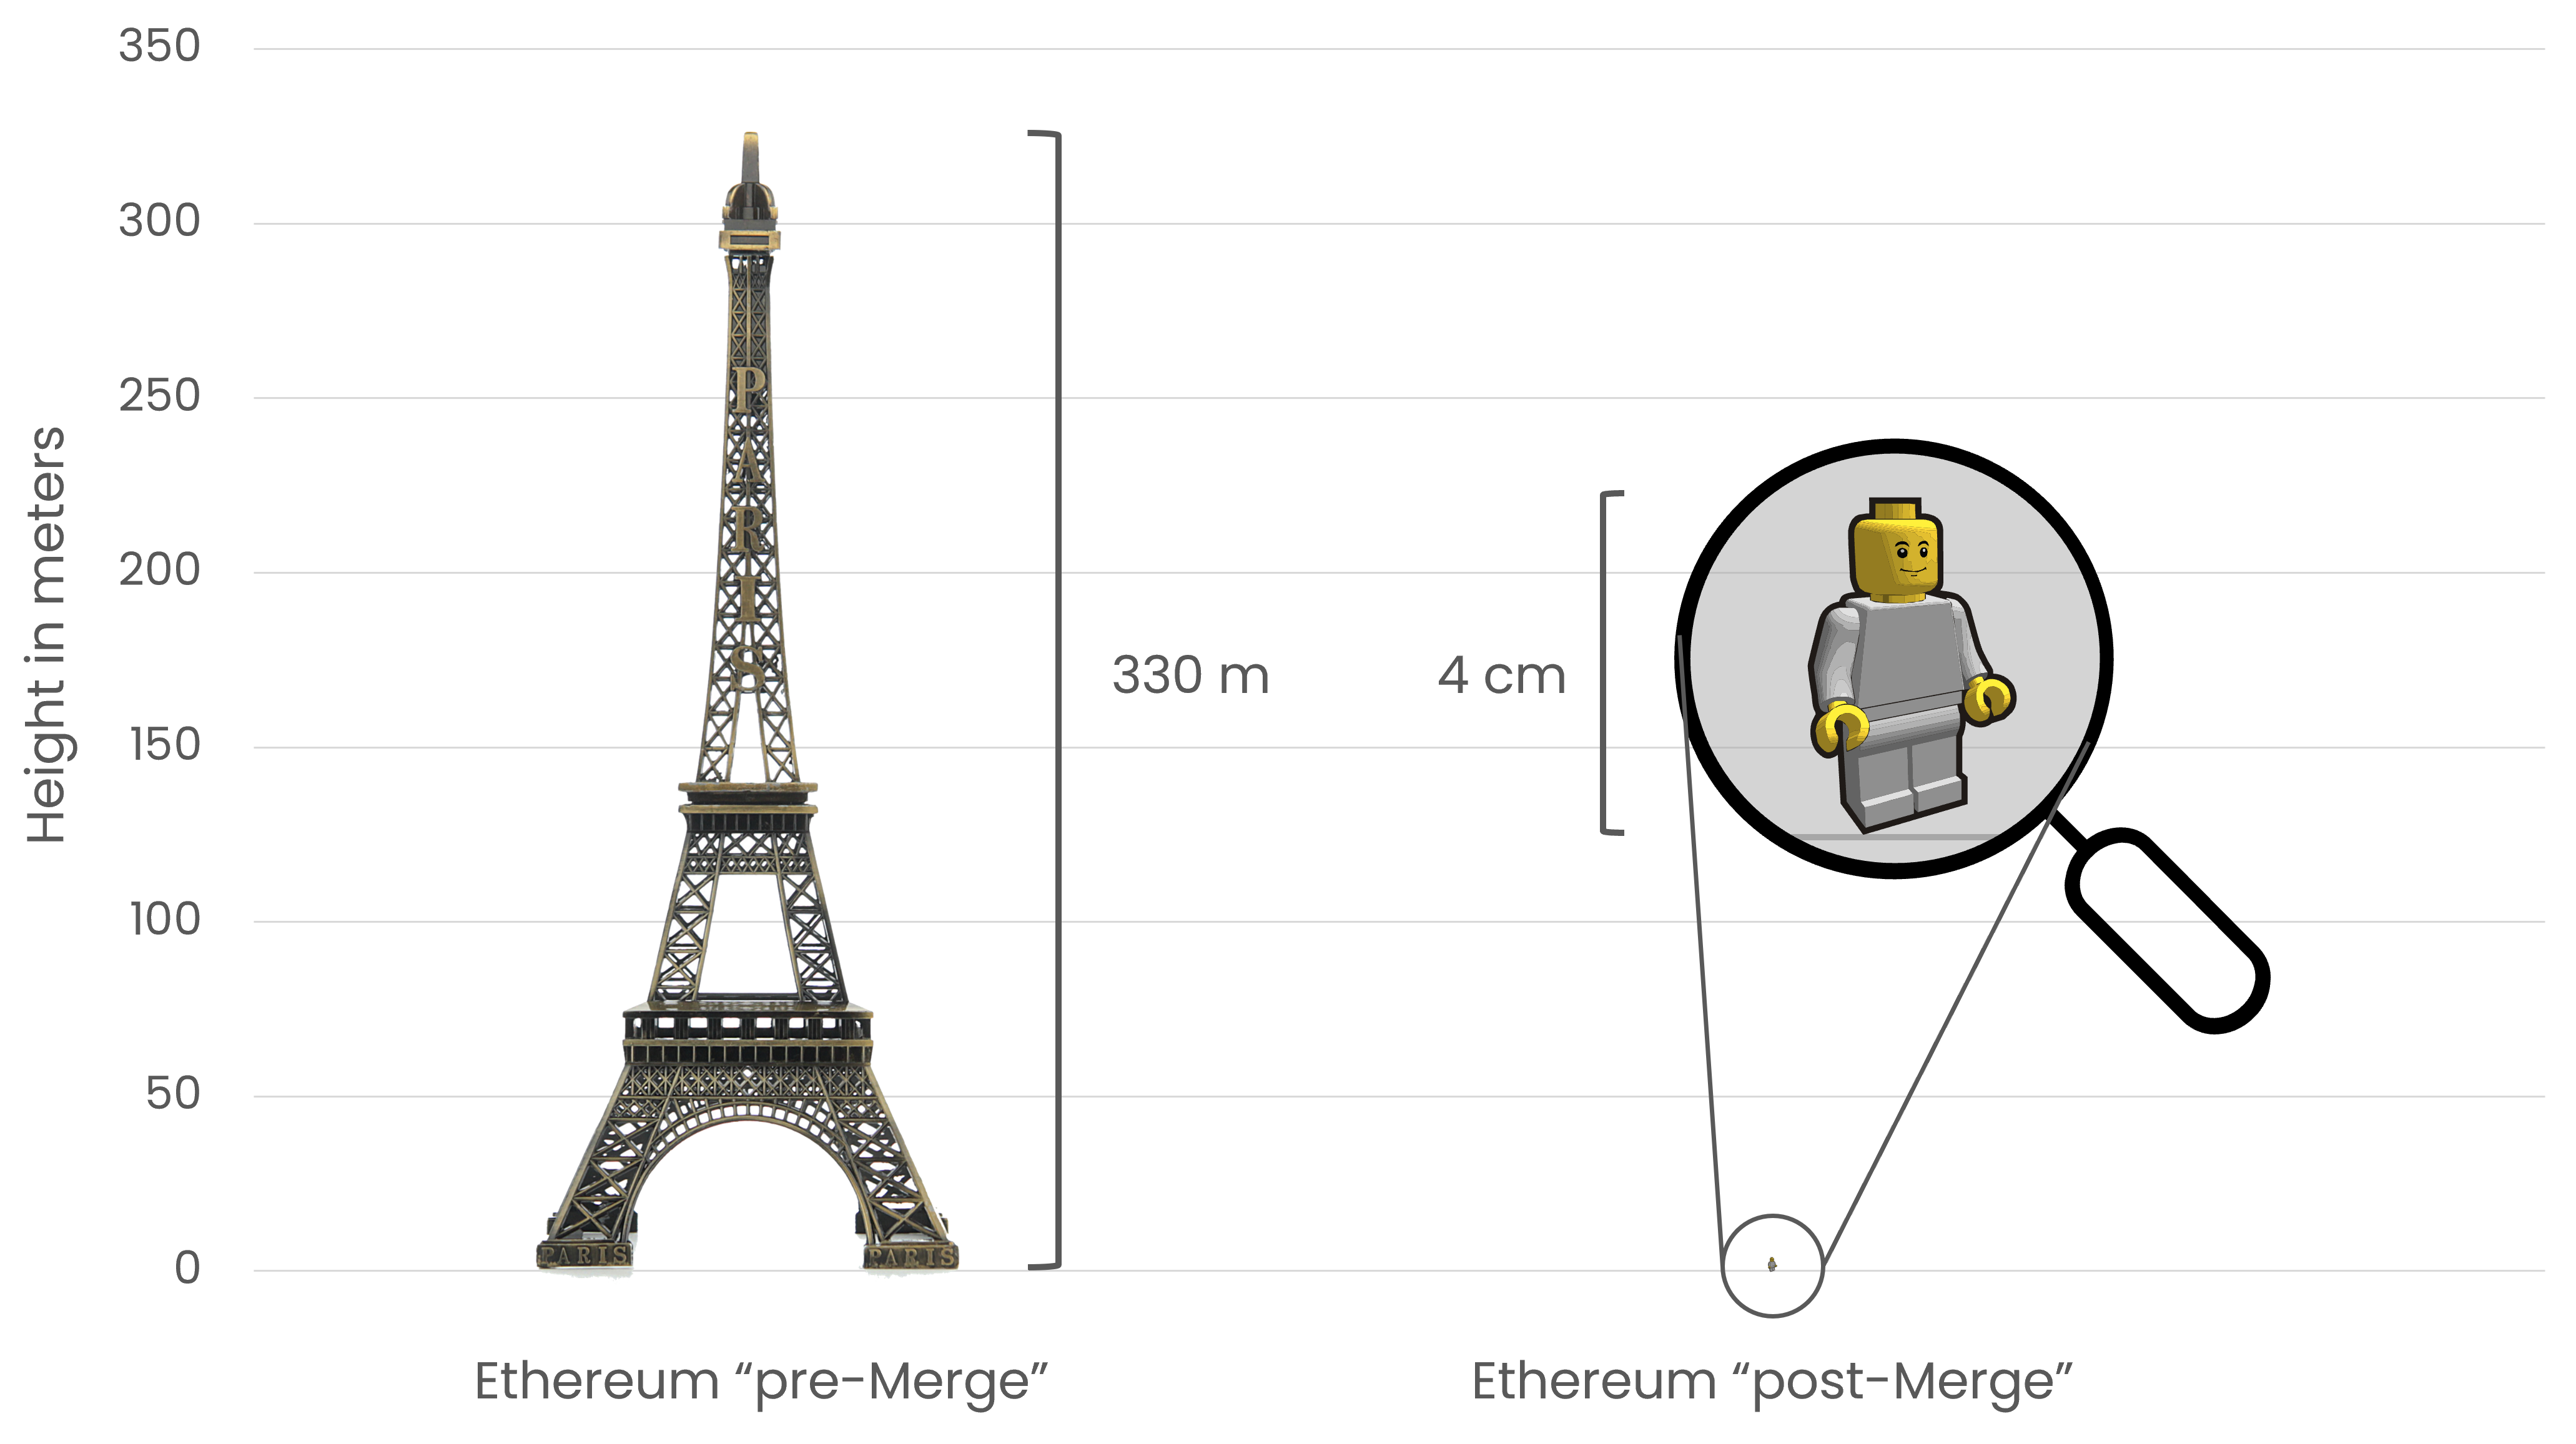
CCRI estimates that The Merge reduced Ethereum's annualized electricity consumption by more than 99.988%. Likewise, Ethereum’s carbon footprint was decreased by approximately 99.992% (from 11,016,000 to 870 tonnes CO2e). To put this in perspective, the reduction in emissions is like going from the height of the Eiffel Tower to a small plastic toy figure, as illustrated in the figure above. As a result, the environmental cost of securing the network is drastically reduced. At the same time, the network's security is believed to have improved.
A green application layer
While Ethereum's energy consumption is very low, there is also a substantial, growing, and highly active regenerative finance (ReFi) community building on Ethereum. ReFi applications use DeFi components to build financial applications that have positive externalities benefiting the environment. ReFi is part of a wider "solarpunk" (opens in a new tab) movement that is closely aligned with Ethereum and aims to couple technological advancement and environmental stewardship. The decentralized, permissionless, and composable nature of Ethereum makes it the ideal base layer for the ReFi and solarpunk communities.
Web3 native public goods funding platforms such as Gitcoin (opens in a new tab) run climate rounds to stimulate environmentally conscious building on Ethereum's application layer. Through the development of these initiatives (and others, e.g., DeSci), Ethereum is becoming an environmentally and socially net-positive technology.
Further reading
- Cambridge Blockchain Network Sustainability Index (opens in a new tab)
- White House report on proof-of-work blockchains (opens in a new tab)
- Ethereum Emissions: A Bottom-up Estimate (opens in a new tab) - Kyle McDonald
- Ethereum Energy Consumption Index (opens in a new tab) - Digiconomist
- ETHMerge.com (opens in a new tab) - @InsideTheSim (opens in a new tab)
- The Merge - Implications on the Electricity Consumption and Carbon Footprint of the Ethereum Network (opens in a new tab) - CCRI
- Ethereum's energy consumption (opens in a new tab)
Related topics
Page last update: February 23, 2026


