使用 InfluxDB 和 Grafana 監控 Geth
本教學將協助你為 Geth 節點設定監控,讓你更了解其效能並找出潛在問題。
先決條件
- 你應該已經在執行一個 Geth 實例。
- 大多數步驟和範例都是針對 Linux 環境,具備基本的終端機知識會很有幫助。
- 觀看這部關於 Geth 指標套件的概覽影片:Péter Szilágyi 的監控以太坊基礎設施 (opens in a new tab)。
監控堆疊
以太坊客戶端會收集大量資料,這些資料可以透過時間序列資料庫的形式讀取。為了讓監控更輕鬆,你可以將這些資料輸入到資料視覺化軟體中。有許多可用的選項:
- Prometheus (opens in a new tab) (拉取模型)
- InfluxDB (opens in a new tab) (推送模型)
- Telegraf (opens in a new tab)
- Grafana (opens in a new tab)
- Datadog (opens in a new tab)
- Chronograf (opens in a new tab)
還有 Geth Prometheus Exporter (opens in a new tab),這是一個預先設定好 InfluxDB 和 Grafana 的選項。
在本教學中,我們將設定你的 Geth 客戶端將資料推送到 InfluxDB 以建立資料庫,並使用 Grafana 建立資料的圖表視覺化。手動執行將有助於你更了解整個過程、進行修改,並在不同的環境中部署。
設定 InfluxDB
首先,讓我們下載並安裝 InfluxDB。可以在 Influxdata 發布頁面 (opens in a new tab)找到各種下載選項。選擇適合你環境的選項。 你也可以從儲存庫 (opens in a new tab)安裝。例如在基於 Debian 的發行版中:
curl -tlsv1.3 --proto =https -sL https://repos.influxdata.com/influxdb.key | sudo apt-key add
source /etc/lsb-release
echo "deb https://repos.influxdata.com/${DISTRIB_ID,,} ${DISTRIB_CODENAME} stable" | sudo tee /etc/apt/sources.list.d/influxdb.list
sudo apt update
sudo apt install influxdb -y
sudo systemctl enable influxdb
sudo systemctl start influxdb
sudo apt install influxdb-client
成功安裝 InfluxDB 後,請確保它在背景執行。預設情況下,可以透過 localhost:8086 存取。
在使用 influx 客戶端之前,你必須建立一個具有管理員權限的新使用者。此使用者將用於高階管理、建立資料庫和使用者。
curl -XPOST "http://localhost:8086/query" --data-urlencode "q=CREATE USER username WITH PASSWORD 'password' WITH ALL PRIVILEGES"
現在你可以使用 influx 客戶端以該使用者身分進入 InfluxDB shell (opens in a new tab)。
influx -username 'username' -password 'password'
在 InfluxDB shell 中直接與其通訊,你可以為 Geth 指標建立資料庫和使用者。
create database geth
create user geth with password choosepassword
使用以下指令驗證建立的項目:
show databases
show users
離開 InfluxDB shell。
exit
InfluxDB 正在執行並已設定為儲存來自 Geth 的指標。
準備 Geth
設定好資料庫後,我們需要在 Geth 中啟用指標收集。請注意 geth --help 中的 METRICS AND STATS OPTIONS。那裡可以找到多個選項,在這種情況下,我們希望 Geth 將資料推送到 InfluxDB。
基本設定指定了可存取 InfluxDB 的端點以及資料庫的驗證資訊。
geth --metrics --metrics.influxdb --metrics.influxdb.endpoint "http://0.0.0.0:8086" --metrics.influxdb.username "geth" --metrics.influxdb.password "chosenpassword"
這些旗標可以附加到啟動客戶端的指令中,或儲存到設定檔中。
你可以驗證 Geth 是否成功推送資料,例如透過列出資料庫中的指標。在 InfluxDB shell 中:
use geth
show measurements
設定 Grafana
下一步是安裝 Grafana,它將以圖形方式解釋資料。請按照 Grafana 文件中針對你環境的安裝程序進行操作。除非你有其他需求,否則請確保安裝 OSS 版本。 使用儲存庫的 Debian 發行版安裝步驟範例:
curl -tlsv1.3 --proto =https -sL https://packages.grafana.com/gpg.key | sudo apt-key add -
echo "deb https://packages.grafana.com/oss/deb stable main" | sudo tee -a /etc/apt/sources.list.d/grafana.list
sudo apt update
sudo apt install grafana
sudo systemctl enable grafana-server
sudo systemctl start grafana-server
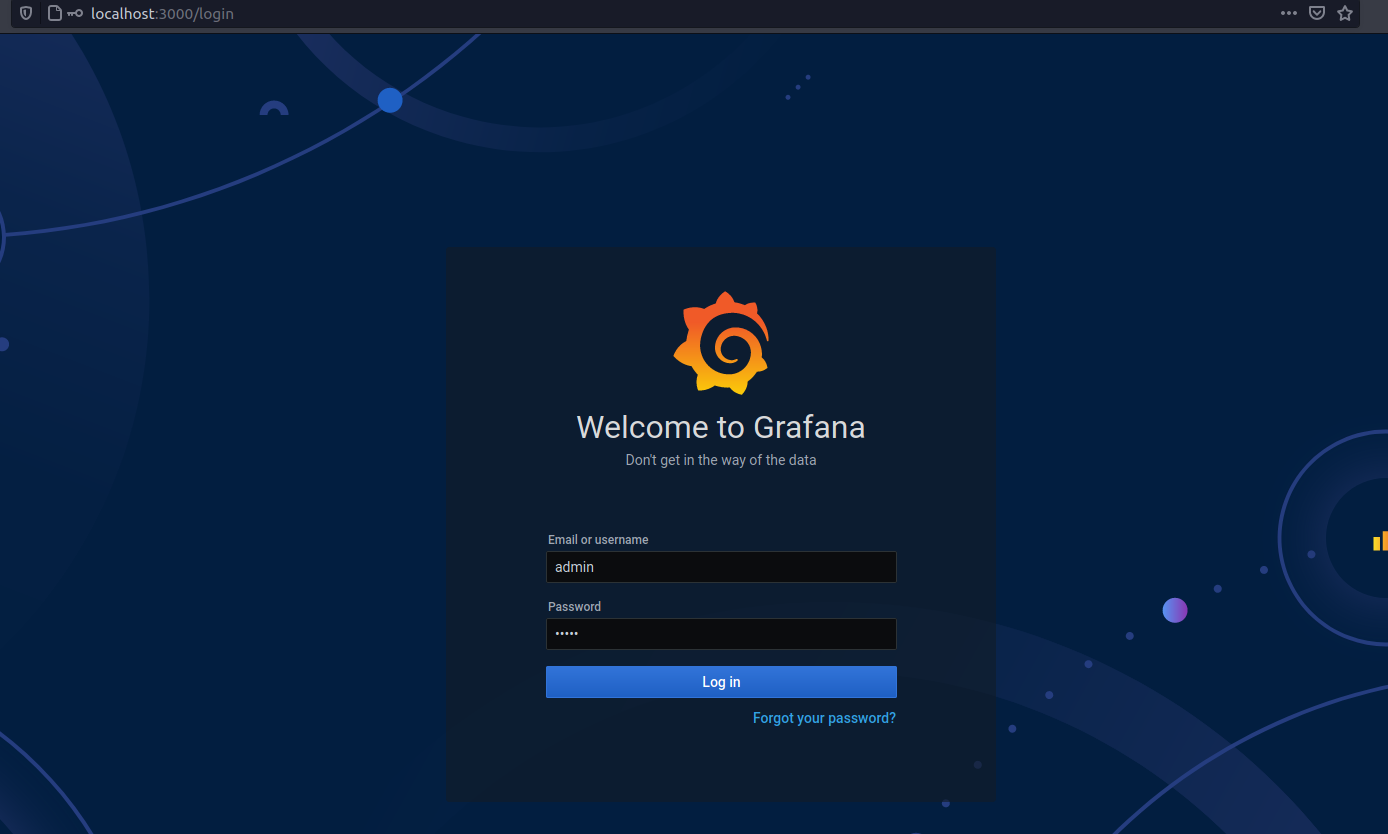
當你執行 Grafana 時,應該可以透過 localhost:3000 存取。
使用你偏好的瀏覽器存取此路徑,然後使用預設憑證登入(使用者:admin,密碼:admin)。出現提示時,變更預設密碼並儲存。
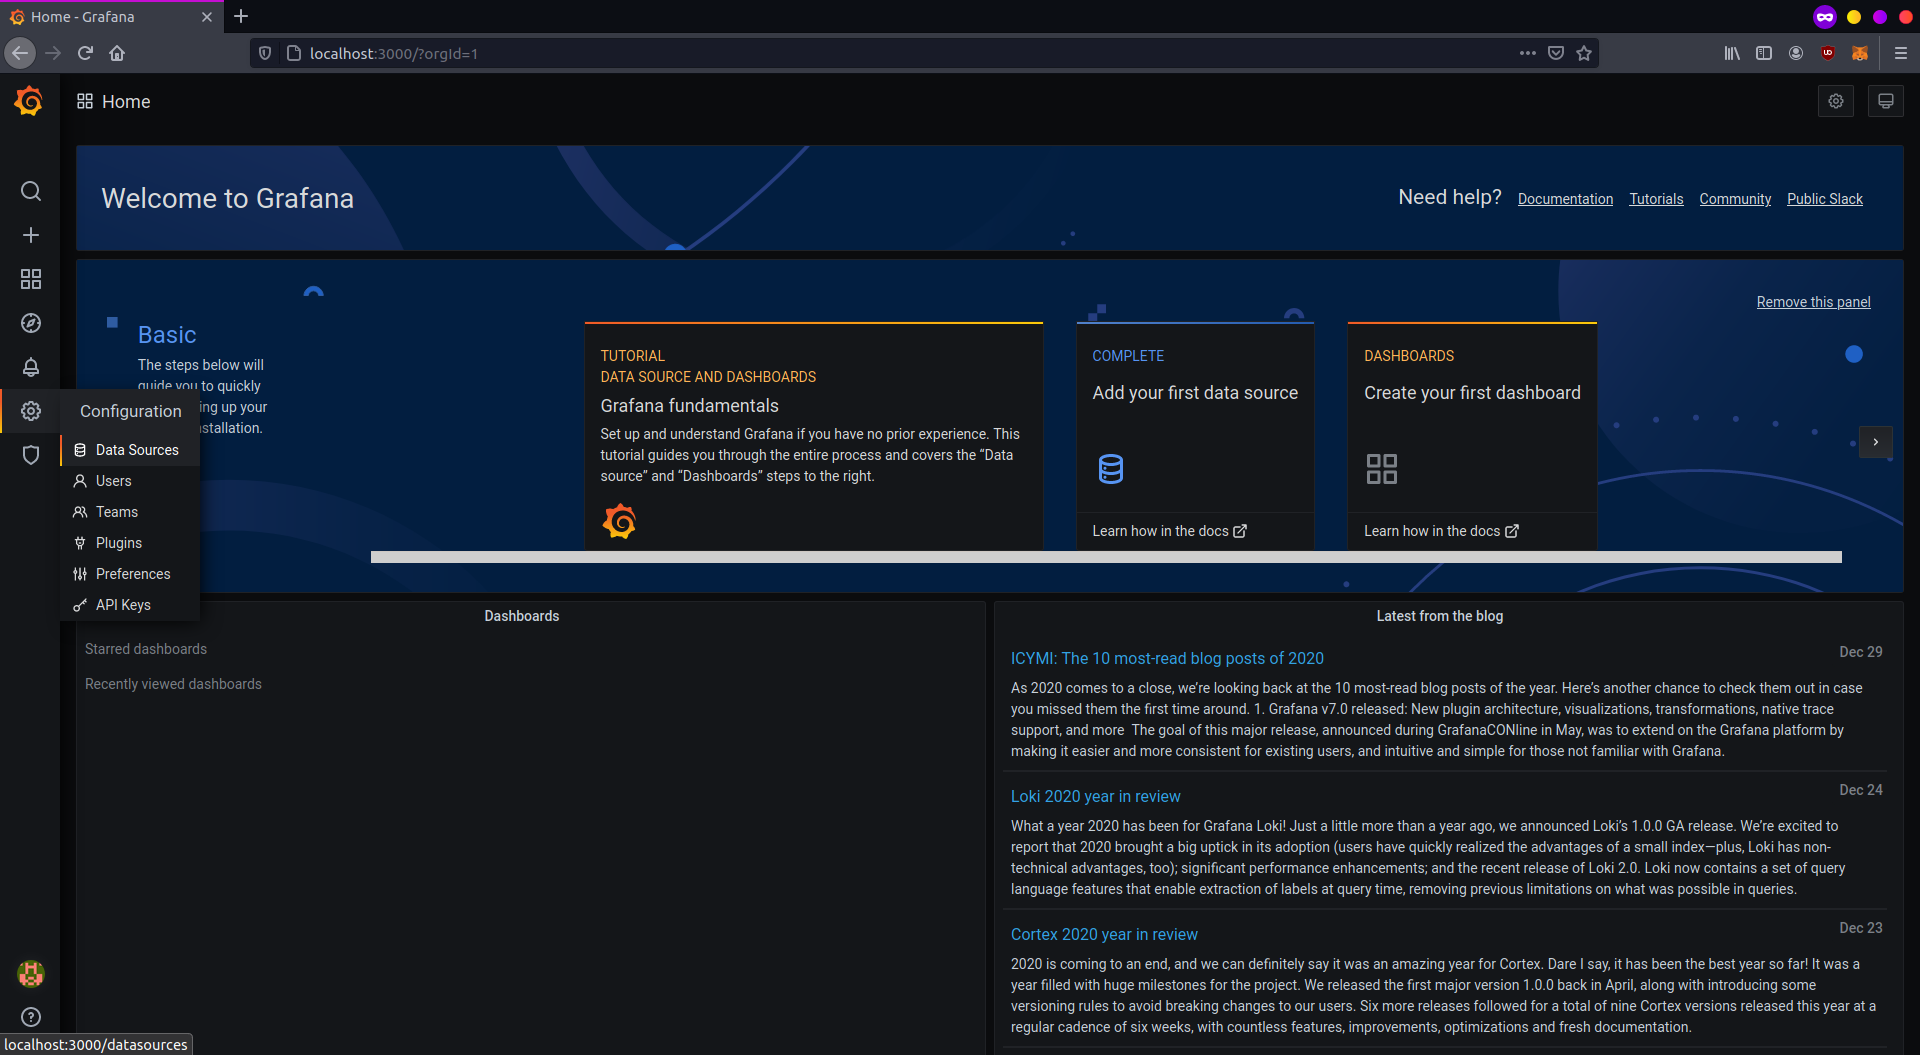
你將被重新導向到 Grafana 首頁。首先,設定你的來源資料。點擊左側欄中的設定圖示,然後選擇「Data sources」(資料來源)。
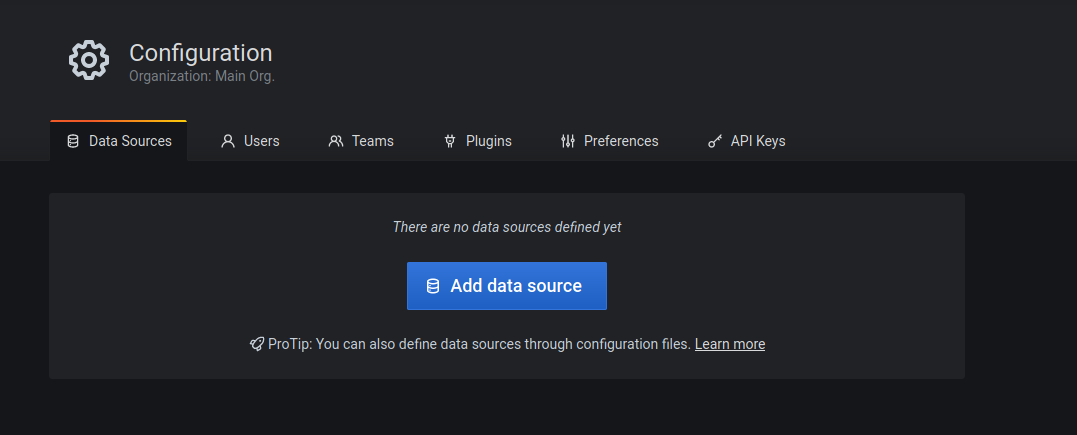
目前尚未建立任何資料來源,點擊「Add data source」(新增資料來源)來定義一個。
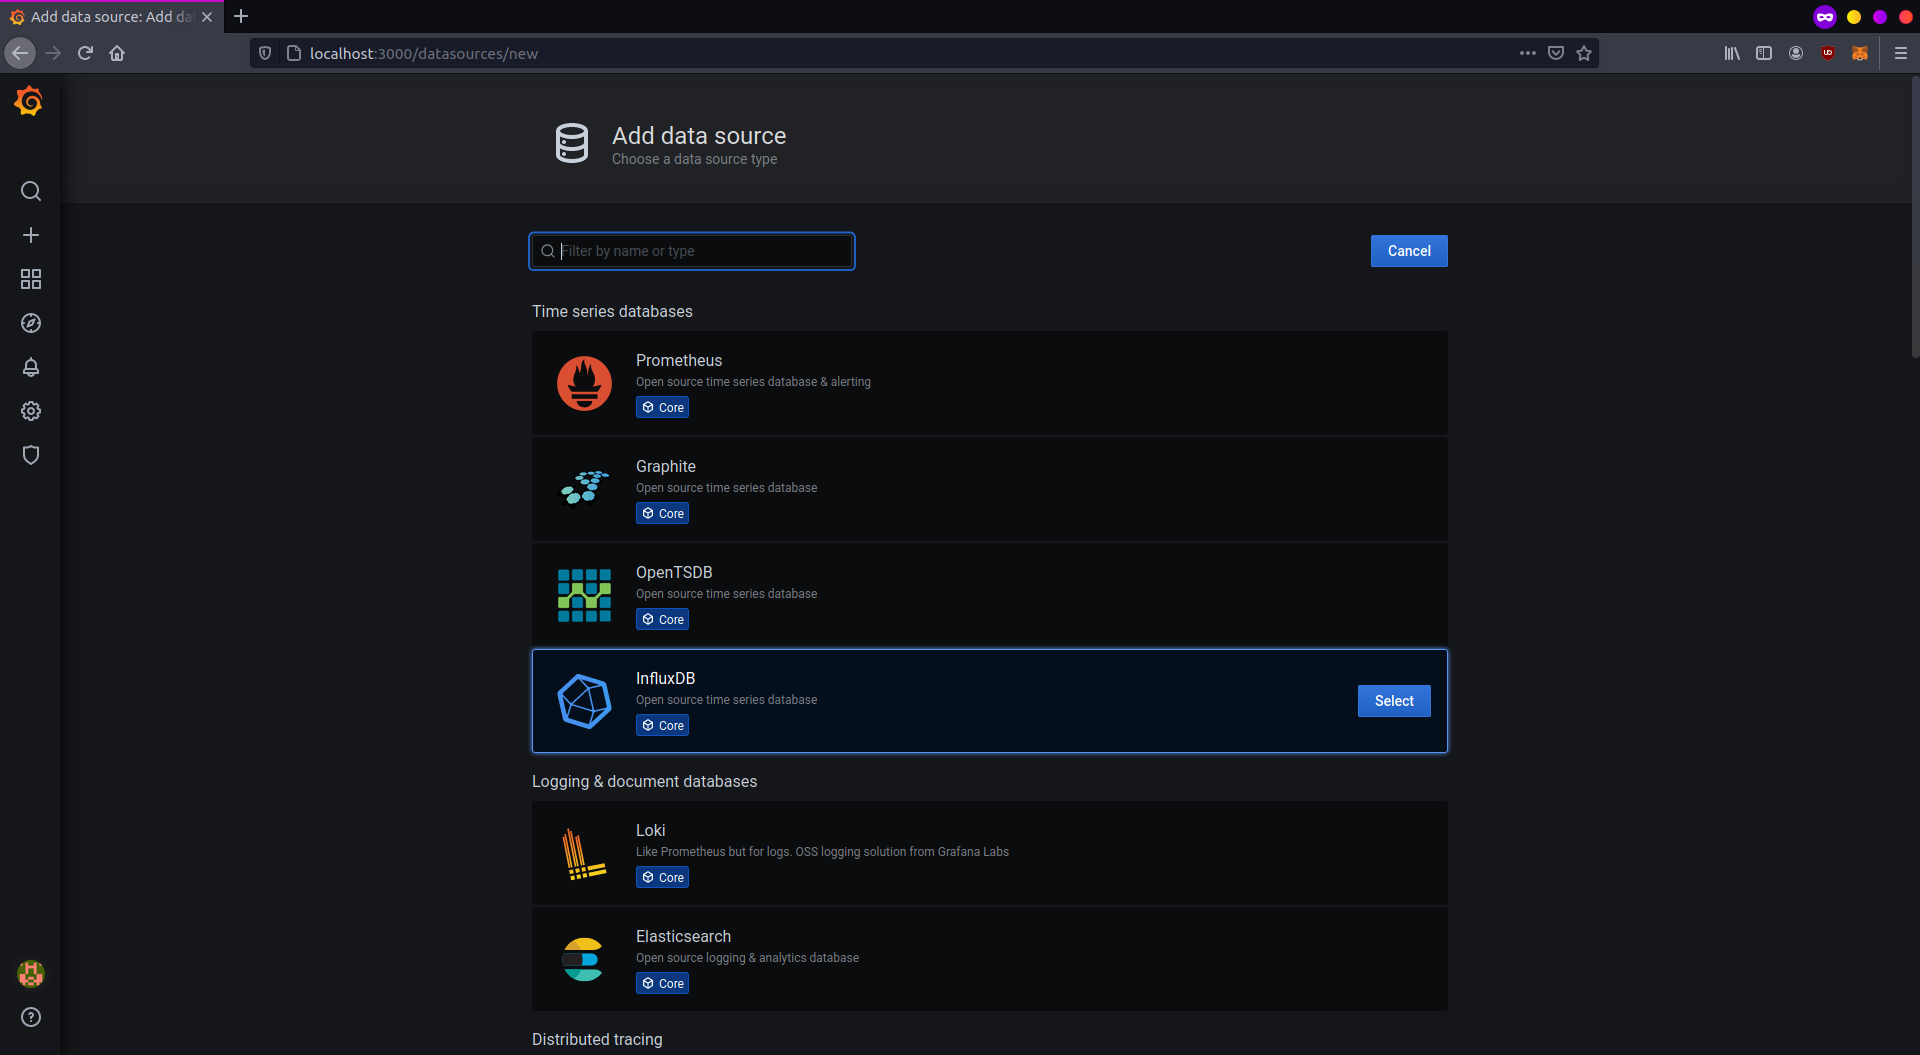
對於此設定,選擇「InfluxDB」並繼續。
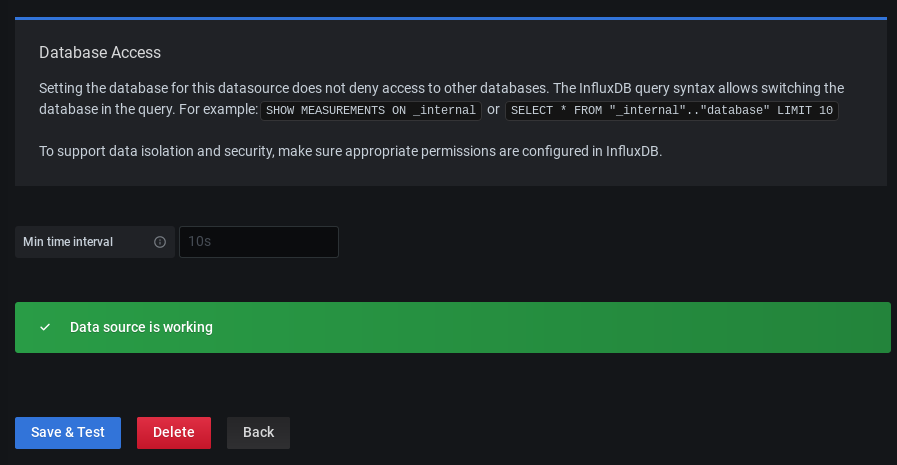
如果你在同一台機器上執行工具,資料來源設定非常簡單。你需要設定 InfluxDB 地址和存取資料庫的詳細資訊。請參考下圖。

如果一切完成且可以存取 InfluxDB,點擊「Save and test」(儲存並測試),然後等待確認訊息彈出。
Grafana 現在已設定為從 InfluxDB 讀取資料。現在你需要建立一個儀表板來解釋並顯示它。儀表板屬性編碼在 JSON 檔案中,任何人都可以建立並輕鬆匯入。在左側欄中,點擊「Create and Import」(建立並匯入)。
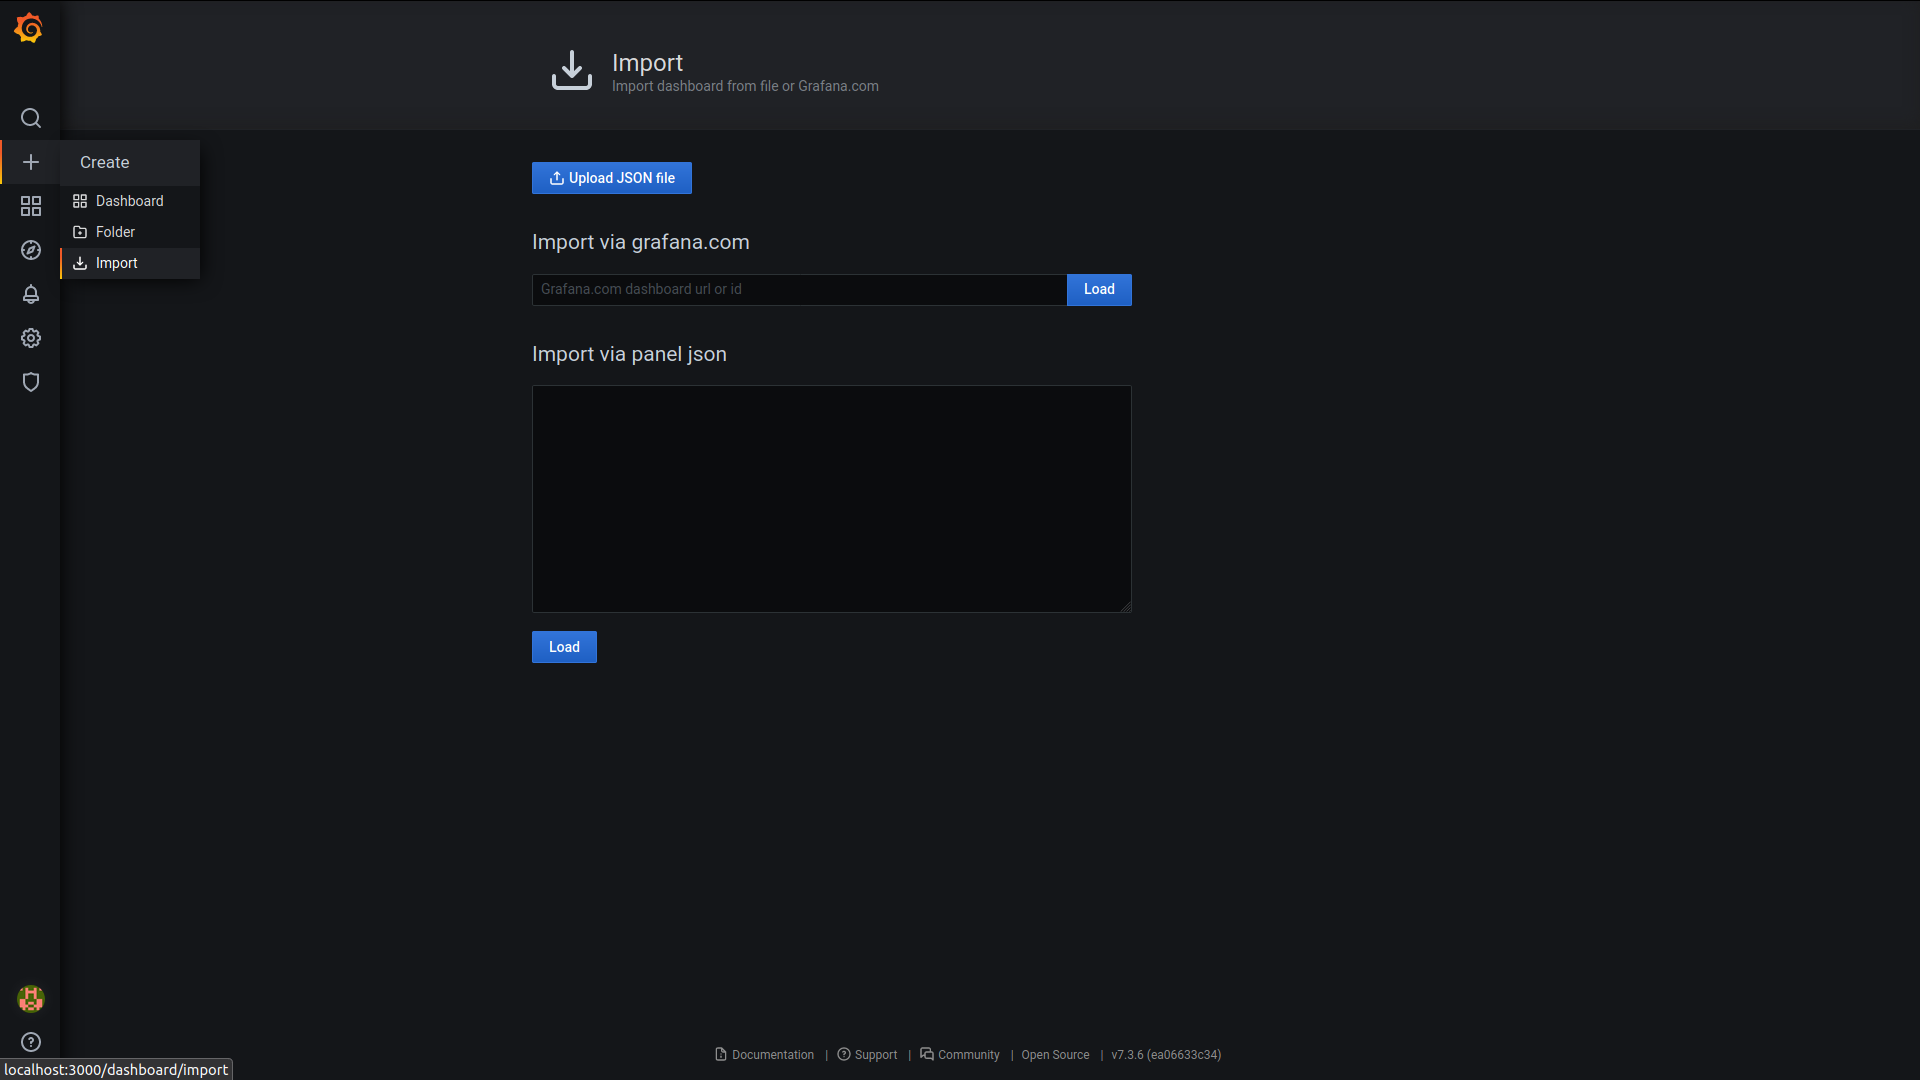
對於 Geth 監控儀表板,複製這個儀表板 (opens in a new tab)的 ID,並將其貼到 Grafana 的「Import page」(匯入頁面)中。儲存儀表板後,它應該看起來像這樣:
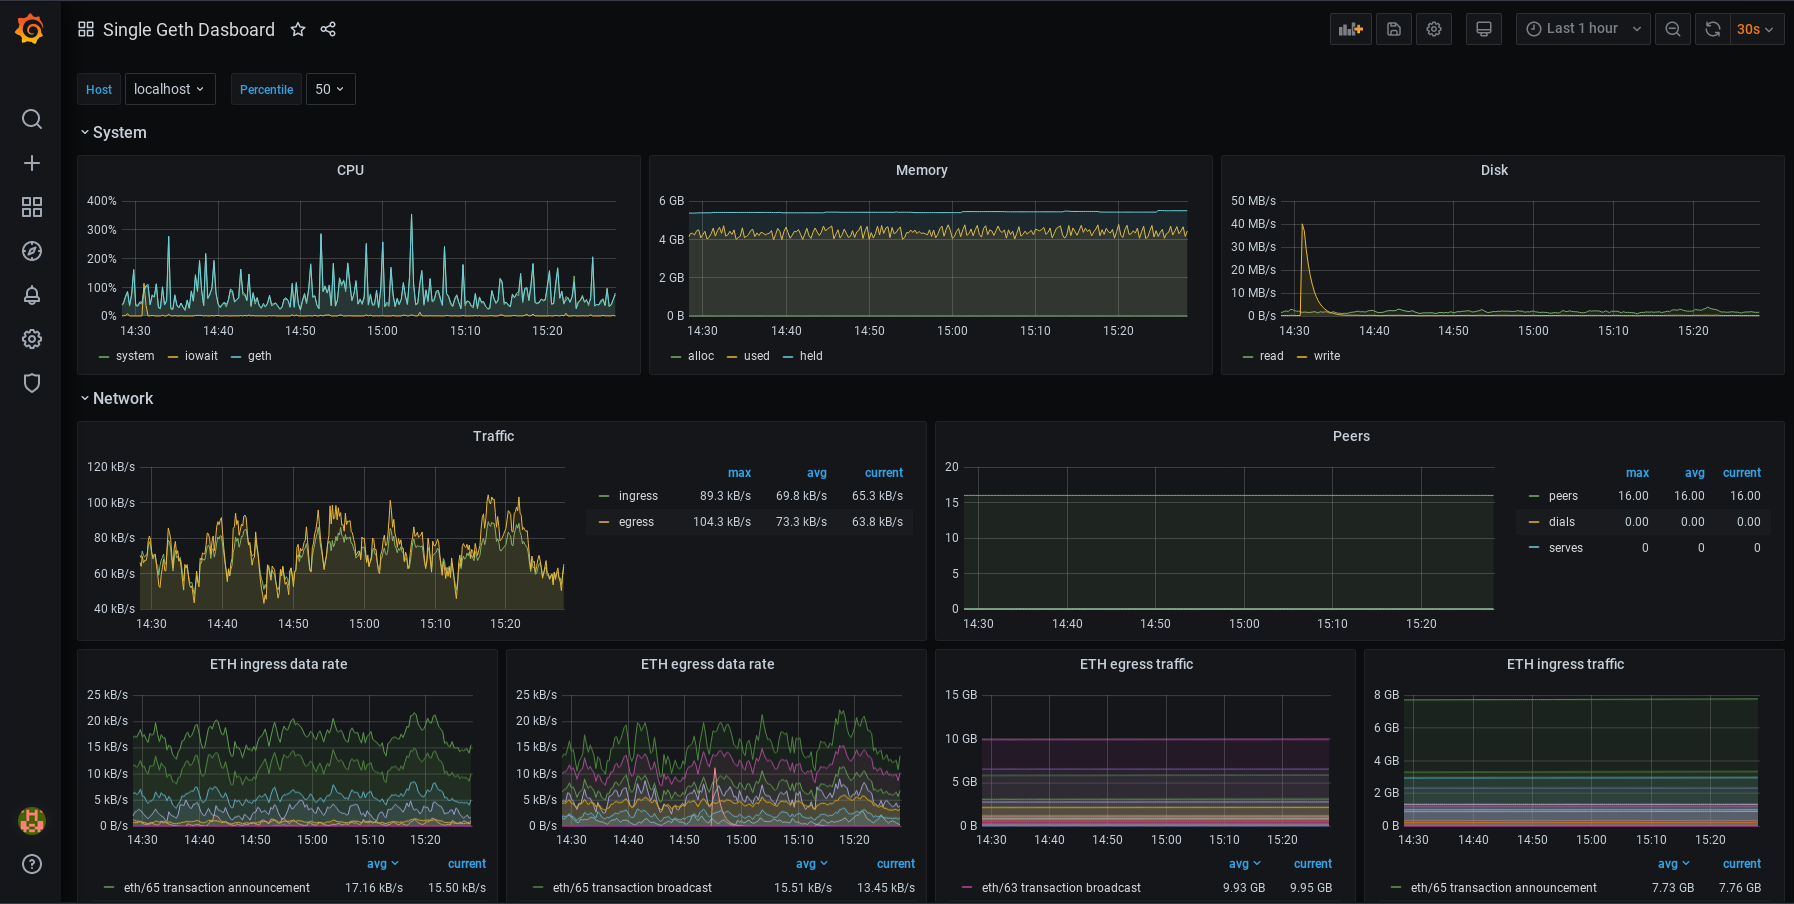
你可以修改你的儀表板。每個面板都可以編輯、移動、移除或新增。你可以變更你的設定。這完全取決於你!要了解更多關於儀表板如何運作的資訊,請參考 Grafana 的文件 (opens in a new tab)。 你可能也對警報 (opens in a new tab)感興趣。這讓你可以設定當指標達到特定數值時的警報通知。支援多種通訊管道。